PinnedErdogan TaskeseninTowards Data ScienceChat with Your Dataset using Bayesian Inferences.The ability to ask questions to your data set has always been an intriguing prospect. You will be surprised how easy it is to learn a local…Nov 13, 20232Nov 13, 20232
PinnedErdogan TaskeseninTowards Data ScienceA Step-by-Step Guide To Accurately Detect Peaks and Valleys.Peak Detection is a challenging step in many applications. Read and learn how to accurately detect peaks and valleys in 1D vectors and 2D…Sep 25, 20235Sep 25, 20235
PinnedErdogan TaskeseninTowards Data ScienceThe Path to Success in Data Science Is About Your Ability to Learn. But What to Learn?The chances of successfully delivering data science projects are greatest when you keep learning, but it’s not always clear what to focus…Jun 29, 20237Jun 29, 20237
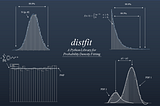
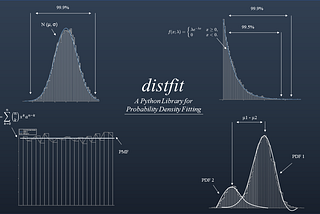
PinnedErdogan TaskeseninTowards Data ScienceHow to Find the Best Theoretical Distribution for Your DataKnowing the underlying data distribution is an essential step for data modeling and has many applications, such as anomaly detection…Feb 3, 202311Feb 3, 202311
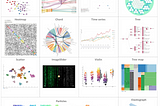
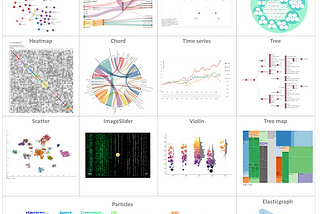
PinnedErdogan TaskeseninTowards Data ScienceD3Blocks: The Python Library to Create Interactive and Standalone D3js Charts.Create interactive, and stand-alone charts that are built on the graphics of d3 javascript (d3js) but configurable with Python.Sep 22, 20229Sep 22, 20229
Erdogan TaskeseninTowards Data ScienceTo Data or Not to Data.The question is not anymore whether we can solve the problem with AI but to what extent it returns sustainable and reliable results. Good…Jan 20Jan 20
Erdogan TaskeseninTowards Data ScienceDetection of Multicollinearity in Data sets using Statistical Testing.Detecting multicollinearity in data sets is an important step but also challenging. I will demonstrate how to detect variables with similar…Oct 21, 20233Oct 21, 20233
Erdogan TaskeseninTowards Data ScienceThe Next Step is Responsible AI. How Do We Get There?Machine learning solutions take an important place in our lives. It is not only about performance anymore but also about responsibility.Aug 26, 20235Aug 26, 20235
Erdogan TaskeseninTowards Data ScienceMaximize Your Insights by Choosing the Best Chart: Network, Heatmap, or Sankey?Beautiful visualizations are great but to maximize the interpretability, you need to choose a chart carefully.Aug 13, 2023Aug 13, 2023
Erdogan TaskeseninTowards Data ScienceEffectively Optimize Your Regression Model with Bayesian Hyperparameter TuningLearn to effectively optimize hyperparameters, and prevent creating overtrained models for XGBoost, CatBoost, and LightBoostJul 17, 2023Jul 17, 2023